Put a lot of effort into new content, but have little idea what happens afterwards? You regularly create information for your displays, update notices and plan new campaigns. Often, work on the next piece of content begins as soon as the previous one has been played. Yet important questions remain unanswered: What was actually displayed? For how long? And which content is being clicked on touchscreens?
The new CMS statistics dashboard from connectSignage makes existing analytics centrally accessible. Digital signage statistics make playback and interaction traceable. With the statistics module in connectSignage, you can evaluate display data for slides and groups, as well as clicks on individual slides on touch displays. This helps you to develop content in a targeted manner and make decisions based on data rather than gut feeling.
What does the new CMS statistics dashboard offer?
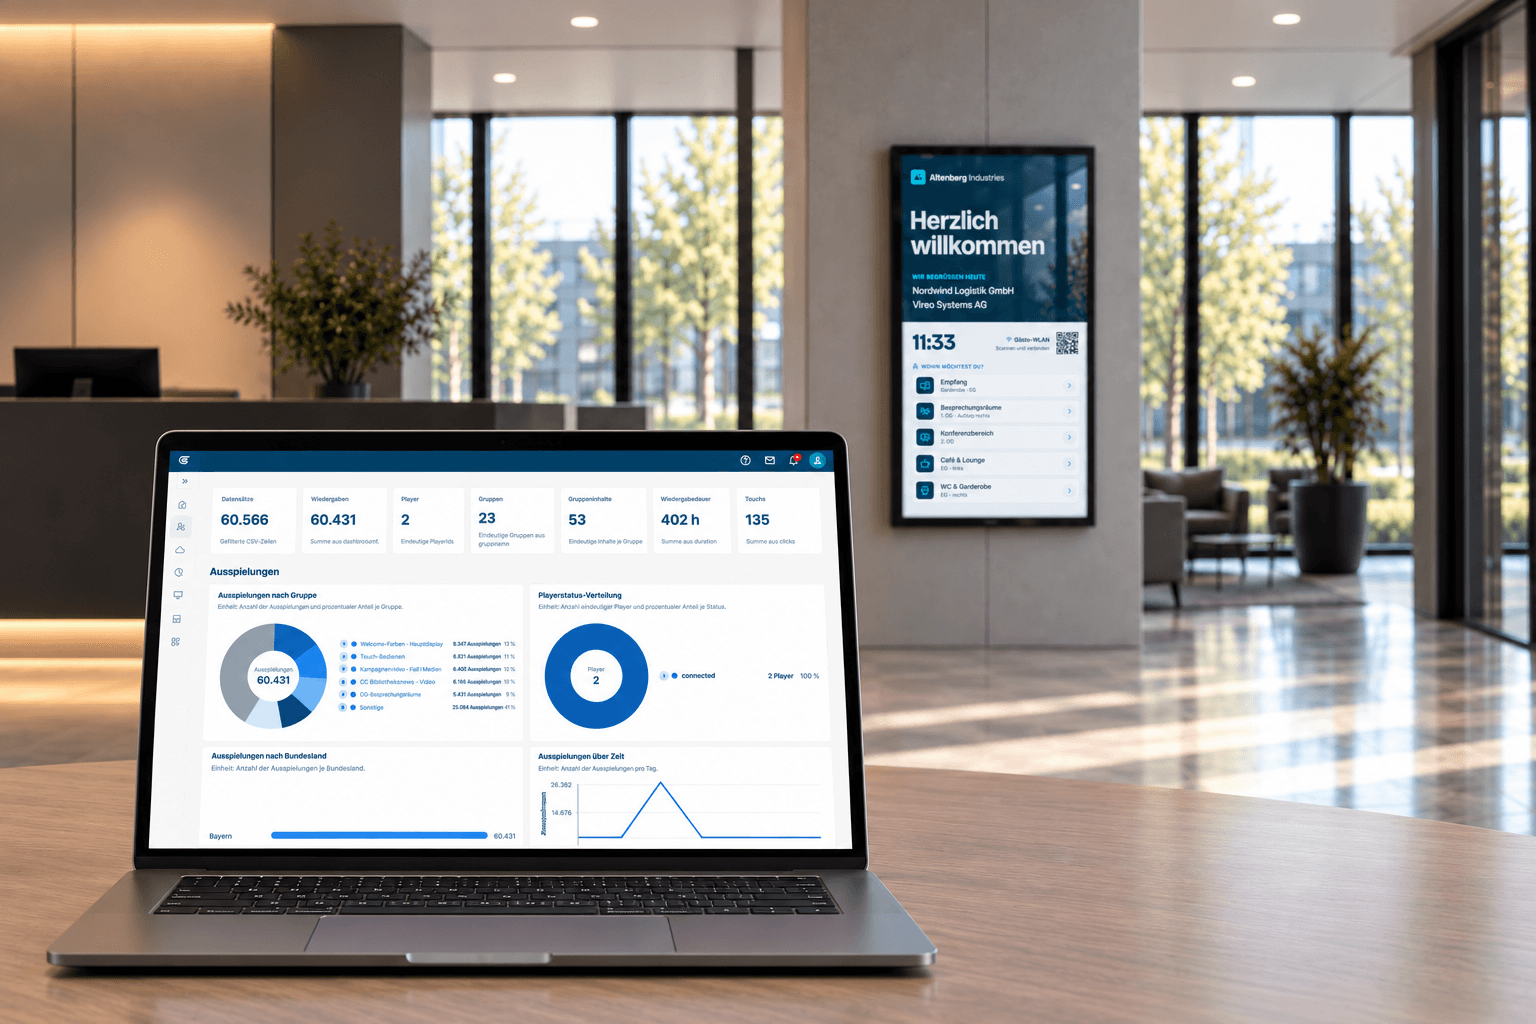
The connectSignage CMS statistics dashboard bundles the overview of statistics profiles, players, locations, groups and time periods. It is accessible directly from the Content Management System (CMS) and helps you to view existing statistical data in a targeted way.
This allows you to navigate through different evaluations: for example, if a profile provides only a few results or if data is available over a longer period. The central overview makes it easier to identify trends and anomalies and to examine relevant players, locations or groups in more detail.
The practical benefit: You can find the right evaluation faster and use the available data to decide where you should take a closer look. This creates a basis for optimising your content as well as for support and further development. How much time the analysis saves depends on your project and the specific questions you are asking.
What can be evaluated with digital signage statistics?
Three key metrics are particularly helpful for evaluation: the number of playbacks, the display duration and, for interactive displays, the number of clicks. They answer different questions and should be considered in the context of their respective use.
Playbacks: Which content was displayed and how often?
The number of playbacks shows how often selected content was displayed on the selected players. This allows you to track, for example, how often an event notice or a campaign item was played during the period under review.
This creates transparency regarding actual display. If content appears less frequently than expected, you can check the assignment, scheduling and operation of the players in question. When making comparisons, the number of players, their operating times and the length of the evaluation period must be taken into account.
Display duration: How long was content on the display?
The display duration describes how long a piece of content was shown. In connectSignage, this can be displayed in seconds, minutes or hours. This allows you to track the presence of individual items within your playback.
A long display duration does not automatically mean that content was viewed for a long time. It describes the display on the screen. Together with the playback figures, it helps you to check the distribution of information.
Touch clicks: Which content is being actively accessed?
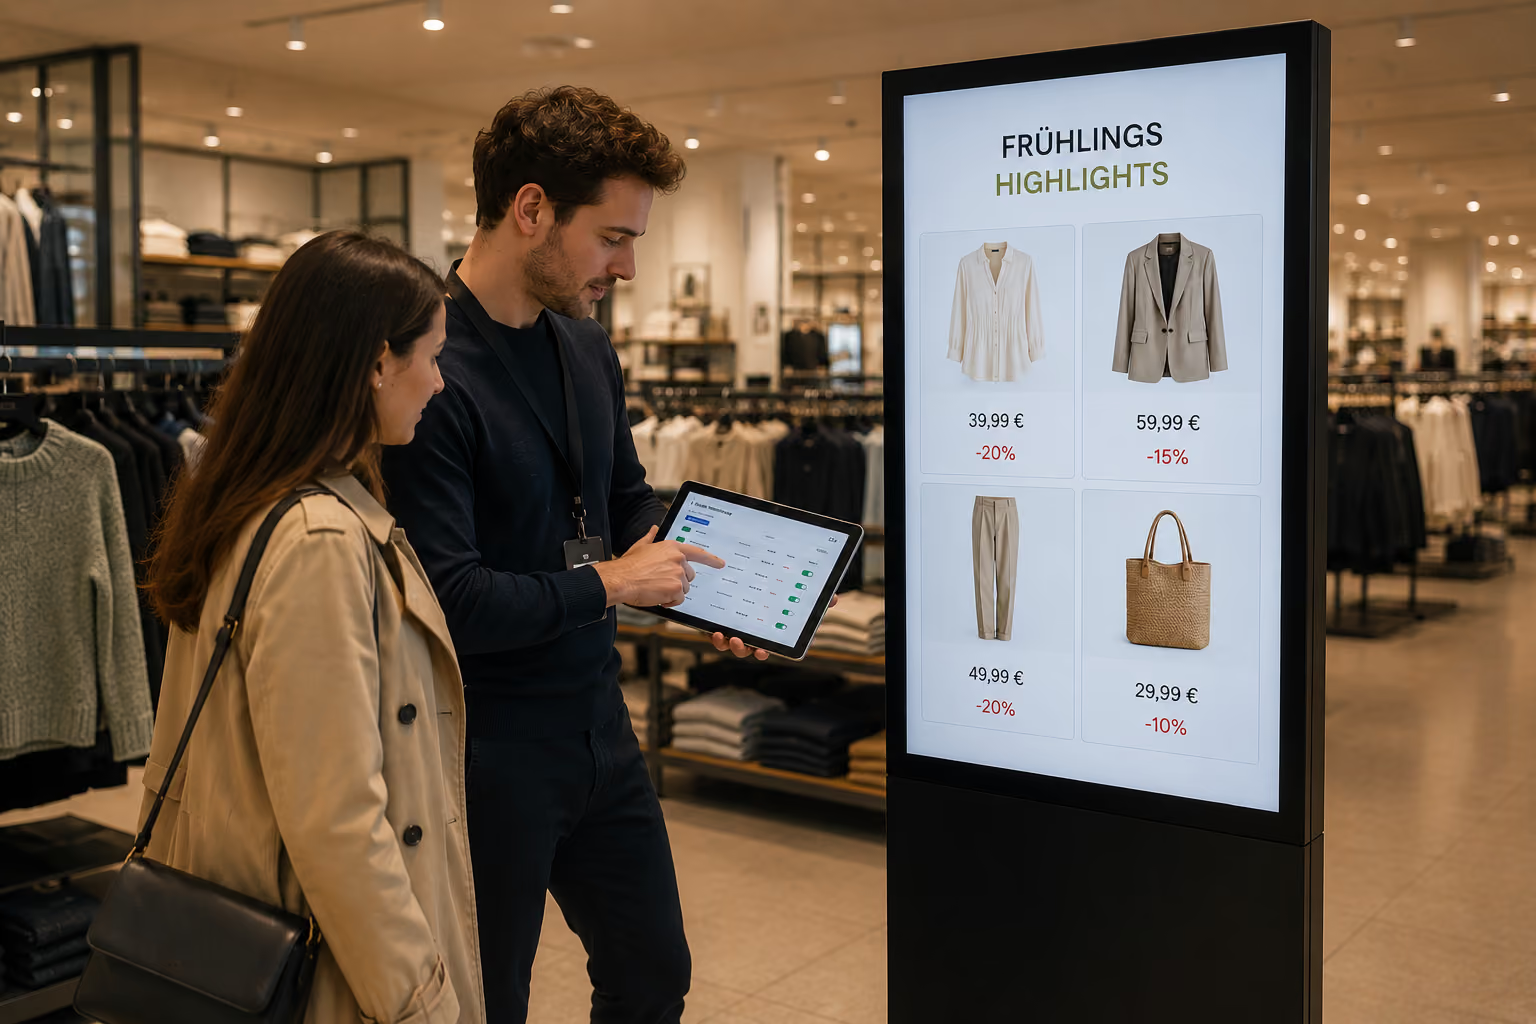
For touch displays, clicks on individual slides are also recorded. This allows you to see which content is clicked on frequently and which is used less. This is interesting, for example, for an interactive information board with event details, course schedules or wayfinding aids.
Clicks provide an indication of interaction. However, they do not automatically show how many different people have used a piece of content or whether they view the content positively.
What added value does this evaluation provide in everyday life?
The greatest benefit comes from using the data to derive a specific question for content maintenance. Instead of updating all content with the same frequency, you can specifically check where adjustments make sense.
- Track playback: Check which content was displayed on your players during the selected period.
- Identify underperforming content: Take a closer look at interactive applications if certain content is rarely clicked.
- Review adjustments: Compare usage before and after a change under as similar conditions as possible.
- Justify decisions: Use the analysis as a basis for further design and planning.
The figures do not replace the need for context. A rarely clicked safety notice may still be important. And a frequently accessed course schedule serves a different purpose than a time-limited campaign.
Practical example: Campaign content is rarely clicked
Imagine an interactive info board that links to a current campaign alongside regularly required information. You have designed the content carefully. However, the statistics show that the corresponding slide is hardly clicked during the period under review.
This is a reason to check access to the content: Is the button clearly visible? Is its label easy to understand? Is it clear what information will follow after tapping?
- Establish the baseline: Select the relevant players, content, and a suitable time frame.
- Test an adjustment: For example, change the placement or labelling of the button.
- Re-evaluate: Look at a comparable period after the change.
- Assess the result: In addition to clicks, check whether operating times, playback, or usage patterns have changed.
This allows you to track whether content is being clicked on more frequently after adjustments. This provides a basis for further testing, without jumping to conclusions about overall campaign performance based on a single metric.
How does the statistics module in connectSignage work?
The statistics module evaluates information regarding the display of slides and groups on players. For touch displays, it also tracks clicks on individual slides. This feature is included in the Professional licence. To collect data, statistics must be enabled in the settings of the respective player.
To perform an evaluation, you create a statistics profile. In it, you select the relevant groups, individual slides if required, the desired players, and the time period. Multiple profiles allow for different types of analysis, for example for specific content or players. Existing profiles can be adjusted later.
The results are presented graphically. Views for display duration and clicks can be viewed individually or combined. For further analysis, the data can be downloaded as a CSV file and evaluated in Excel, for example.
You can find the individual setup steps in our guide to the statistics module in the knowledge base.
Conclusion: Gaining insights from content
Evaluating digital signage content helps you make playback more transparent and improve interactive content more effectively. Playback counts show frequency, display duration describes presence on the screen, and touch clicks make active engagement trackable.
By regularly reviewing this data and testing adjustments in a targeted way, you can develop your content step by step. In this way, past playback provides insights for your next content decisions.
Would you like to find out how you can use the statistics module in your project? Speak to our team or discover the connectSignage platform.
Frequently asked questions about digital signage statistics
What data does the statistics module collect?
It collects information on the display of slides and groups on players. This includes playback counts and display duration. For touch displays, clicks on individual slides are also evaluated.
Does display duration show how long people look at content?
No. It describes how long the content was shown on the display. It cannot be used to measure how long people actually looked at it.
Can I evaluate only specific content or players?
Yes. In a statistics profile, you can select the desired groups, slides, players, and the time period for the evaluation.
How do click statistics help with optimisation?
They reveal which content is clicked frequently and which is rarely clicked. For example, you can reposition a button or make its label clearer, and then compare the clicks over similar time periods.
Can I export the data?
Yes. The evaluation can be downloaded as a CSV file and further analysed using Excel or other suitable software.
What are the requirements for using statistics?
The statistics feature is included in the Professional licence. Data collection must be enabled for the respective players. Setup instructions can be found in the linked knowledge base.
Bereit für einfaches und leistungsstarkes Digital Signage?
Erlebe connectSignage live und entdecke, wie du digitale Displays, Inhalte und Standorte zentral steuerst und Digital Signage für deine Unternehmenskommunikation einsetzt.
Weitere Insights rund um Digital Signage
Entdecke weitere Artikel zu Digital Signage, interner Kommunikation, Integrationen und konkreten Anwendungsfällen.
.png)

.png)
.png)
.png)
.png)
.png)
.png)